Do you know what your highway outfalls are doing during a storm?
- Mar 31
- 4 min read
Most teams can model and predict how their drainage systems will convey water during rainfall events. What is much harder to evidence is the environmental impact of those events in real time.


During rainfall, drainage systems do exactly what they are designed to do. They move water off road surfaces quickly and safely. In doing so, they can also deliver short, concentrated pulses of accumulated pollutants into receiving waters. These pulses can peak and pass within a couple of hours, often before any manual inspection takes place.
When questions arise, whether from regulators, communities, or internal teams, the gap is not in understanding whether a discharge occurred. It is in understanding what that discharge carried and what it did to the receiving environment.
Teams often cannot say with confidence what level of contaminants were present during a specific storm event, whether observed impacts are attributable to their infrastructure or upstream sources, or how conditions changed during the event window itself.
That's the position continuous monitoring and predictive modelling is designed to change.
What a short deployment on the River Darwen showed
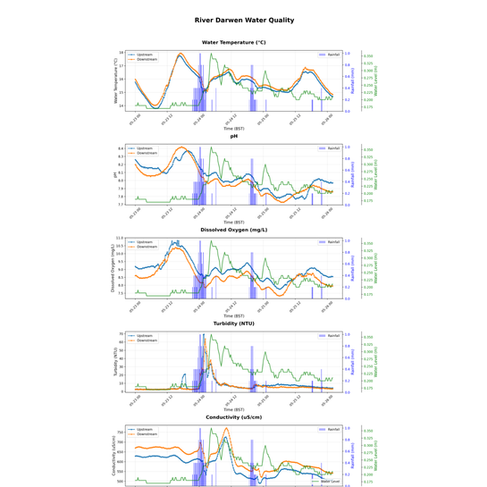
From 23 May to 7 June 2025, AquaWatch deployed two continuous monitoring stations on the River Darwen, one upstream, one downstream of an M6 highway stormwater outfall. Both measured temperature, pH, dissolved oxygen, turbidity and conductivity throughout the monitoring period.
During dry conditions the two sites tracked closely. During rainfall they diverged.
The downstream station showed pronounced turbidity spikes during and after heavy rainfall that were not mirrored upstream. Conductivity dropped initially, dilution from surface runoff, then rose sharply, a pattern associated with road and urban runoff entering the system. Dissolved oxygen fell more steeply downstream during events. pH at the downstream site elevated during and after wet weather in a way consistent with highway runoff.
This happened repeatedly across the monitoring period, and it was most pronounced when rainfall exceeded 2mm/hour.
When both stations respond similarly to rainfall, the cause is likely catchment-wide, something affecting the whole river. When only the downstream station responds, the source is between the two monitoring points. In this case, the outfall sits between them. The continuous data produced a clear, repeatable signal attributable to a specific piece of drainage infrastructure, across multiple events, in two weeks.


That's enough to say: this outfall is worth looking at more closely.
Working with Stormwater Shepherds to go further
Continuous sensor data tells you something is happening. Laboratory analysis tells you what's in the water.
AquaWatch worked alongside Stormwater Shepherds, who had the ability to use the live monitoring data to time their grab sampling at the M6 outfall. That timing matters more than it might seem. The first flush, the initial pulse of runoff carrying the highest contaminant concentrations, typically occurs within the first two hours of a significant rainfall event. Sample outside that window and you'll likely miss the worst of it but sampling through the recovery period also lets you see how resilient the water system is.


By using the AquaWatch event detection to identify when discharge events were underway, Stormwater Shepherds were able to collect samples during peak conditions rather than after them. The laboratory results confirmed elevated concentrations of suspended solids, chemical oxygen demand, metals including zinc, copper and lead, and PAHs, some of which exceed UK Environmental Quality Standard Maximum Allowable Concentrations. Further downstream, concentrations were substantially lower, consistent with dilution and natural attenuation.
Those findings belong to Stormwater Shepherds' sampling programme. AquaWatch water management provides the triggers to get them at the right time.
What this means in practice for highways teams
Prioritisation across a network. No team has the resources to investigate every outfall. A short deployment, two weeks, two sensors, a handful of storm events, can tell you whether a specific discharge is behaving distinctly from its catchment context. That's a triage tool. It tells you where to focus attention and, equally usefully, where not to.
Getting ahead of the conversation. Regulatory enquiries and community complaints about river quality are easier to handle when you already have data. Continuous monitoring means you know what your drainage did during last Tuesday's storm before anyone asks. That shifts the dynamic from reactive defence to informed briefing.
Answering the attribution question. The upstream-downstream methodology doesn't just detect changes, it helps attribute them. When a river looks poor after rain, is it your outfall or something further upstream? Without paired monitoring you're speculating. With it you have a defensible answer.
A record that stands up. Continuous data across multiple events is a different class of evidence from occasional spot samples. It shows how the system behaves across a range of conditions, not just on the day someone happened to visit.
Justifying what comes next. Whether the next step is a mitigation scheme, an extended monitoring programme or a decision that no further action is needed, the case is stronger when it's built on evidence rather than assumption. Pre- and post-intervention monitoring using the same methodology can also demonstrate whether any mitigation spend is actually working.
What two weeks can and can't tell you
It won't characterise seasonal variation or cumulative loading. It won't replace a long-term programme where one is warranted. The River Darwen findings should be treated as indicative.
What it will do is answer the question that matters first: is there a signal here worth taking seriously?
On the River Darwen, after two weeks, the answer was clearly yes. That's a useful thing to know quickly and cheaply, before committing to anything larger.
Each week of the River Darwen deployment, AquaWatch produced an interpreted summary through the SWIM-OS platform, plain-language analysis of what the monitoring period showed, event responses identified, and recommendations for next steps.
Our objective is that the people responsible for managing drainage infrastructure get clear, usable information from their monitoring data without needing to interpret everything themselves.
If you manage highway drainage and want to understand how your outfalls interact with receiving waters during rainfall, we're glad to talk about what that could like like. Email us on enquiries@aquawatchsolutions.com


Comments